Transposing
Overview
These functions were created to solve common problems with reshaping your data: pivoting cells from a row into a column, or pivoting cells from a column into a row. You can also transpose from a repeated set of values into multiple columns.
Transpose cells across columns into rows
Imagine personal data with addresses in this format:
| Name | Street | City | State/Province | Country | Postal code |
|---|---|---|---|---|---|
| Jacques Cousteau | 23, quai de Conti | Paris | France | 75270 | |
| Emmy Noether | 010 N Merion Avenue | Bryn Mawr | Pennsylvania | USA | 19010 |
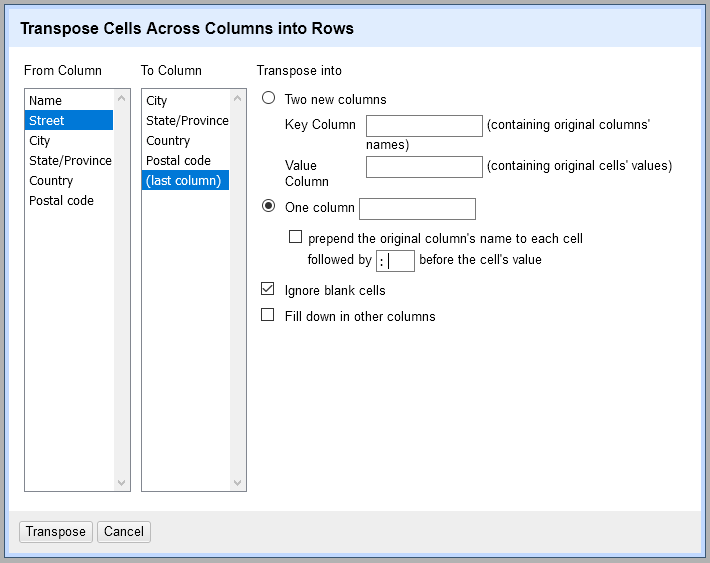
You can transpose the address information from this format into multiple rows. Go to the “Street” column and select → . From there you can select all of the five columns, starting with “Street” and ending with “Postal code,” that correspond to address information. Once you begin, you should put your project into records mode to associate the subsequent rows with “Name” as the key column.

One column
You can transpose the multiple address columns into a series of rows:
| Name | Address |
|---|---|
| Jacques Cousteau | 23, quai de Conti |
| Paris | |
| France | |
| 75270 | |
| Emmy Noether | 010 N Merion Avenue |
| Bryn Mawr | |
| Pennsylvania | |
| USA | |
| 19010 |
You can choose one column and include the column-name information in each cell by prepending it to the value, with or without a separator:
| Name | Address |
|---|---|
| Jacques Cousteau | Street: 23, quai de Conti |
| City: Paris | |
| Country: France | |
| Postal code: 75270 | |
| Emmy Noether | Street: 010 N Merion Avenue |
| City: Bryn Mawr | |
| State/Province: Pennsylvania | |
| Country: USA | |
| Postal code: 19010 |
Two columns
You can retain the column names as separate cell values, by selecting Two new columns and naming the key and value columns.
| Name | Address part | Address |
|---|---|---|
| Jacques Cousteau | Street | 23, quai de Conti |
| City | Paris | |
| Country | France | |
| Postal code | 75270 | |
| Emmy Noether | Street | 010 N Merion Avenue |
| City | Bryn Mawr | |
| State/Province | Pennsylvania | |
| Country | USA | |
| Postal code | 19010 |
Transpose cells in rows into columns
Imagine employee data in this format:
| Column |
|---|
| Employee: Karen Chiu |
| Job title: Senior analyst |
| Office: New York |
| Employee: Joe Khoury |
| Job title: Junior analyst |
| Office: Beirut |
| Employee: Samantha Martinez |
| Job title: CTO |
| Office: Tokyo |
The goal is to sort out all of the information contained in one column into separate columns, but keep it organized by the person it represents:
| Name | Job title | Office |
|---|---|---|
| Karen Chiu | Senior analyst | New York |
| Joe Khoury | Junior analyst | Beirut |
| Samantha Martinez | CTO | Tokyo |
By selecting → a window will appear that simply asks how many rows to transpose. In this case, each employee record has three rows, so input “3” (do not subtract one for the original column). The original column will disappear and be replaced with three columns, with the name of the original column plus a number appended.
| Column 1 | Column 2 | Column 3 |
|---|---|---|
| Employee: Karen Chiu | Job title: Senior analyst | Office: New York |
| Employee: Joe Khoury | Job title: Junior analyst | Office: Beirut |
| Employee: Samantha Martinez | Job title: CTO | Office: Tokyo |
From here you can use → to remove “Employee: ”, “Job title: ”, and “Office: ” if you wish, or use expressions with → to clean out the extraneous characters:
value.replace("Employee: ", "")
If your dataset doesn't have a predictable number of cells per intended row, such that you cannot specify easily how many columns to create, try .
Columnize by key/value columns
This operation can be used to reshape a dataset that contains key and value columns: the repeating strings in the key column become new column names, and the contents of the value column are moved to new columns. This operation can be found at → .

Consider the following example, with flowers, their colours, and their International Union for Conservation of Nature (IUCN) identifiers:
| Field | Data |
|---|---|
| Name | Galanthus nivalis |
| Color | White |
| IUCN ID | 162168 |
| Name | Narcissus cyclamineus |
| Color | Yellow |
| IUCN ID | 161899 |
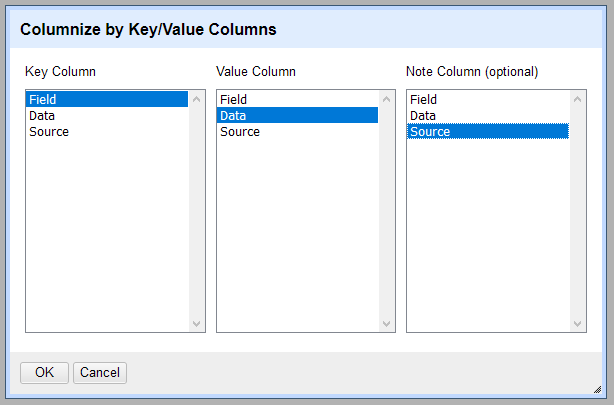
In this format, each flower species is described by multiple attributes on consecutive rows. The “Field” column contains the keys and the “Data” column contains the values. In the window you can select each of these from the available columns. It transforms the table as follows:
| Name | Color | IUCN ID |
|---|---|---|
| Galanthus nivalis | White | 162168 |
| Narcissus cyclamineus | Yellow | 161899 |
Entries with multiple values in the same column
If a new row would have multiple values for a given key, then these values will be grouped on consecutive rows, to form a record structure.
For instance, flowers can have multiple colors:
| Field | Data |
|---|---|
| Name | Galanthus nivalis |
| Color | White |
| Color | Green |
| IUCN ID | 162168 |
| Name | Narcissus cyclamineus |
| Color | Yellow |
| IUCN ID | 161899 |
This table is transformed by the Columnize operation to:
| Name | Color | IUCN ID |
|---|---|---|
| Galanthus nivalis | White | 162168 |
| Green | ||
| Narcissus cyclamineus | Yellow | 161899 |
The first key encountered by the operation serves as the record key, so the “Green” value is attached to the “Galanthus nivalis” name. See the Row order section for more details about the influence of row order on the results of the operation.
Notes column
In addition to the key and value columns, you can optionally add a column for notes. This can be used to store extra metadata associated to a key/value pair.
Consider the following example:
| Field | Data | Source |
|---|---|---|
| Name | Galanthus nivalis | IUCN |
| Color | White | Contributed by Martha |
| IUCN ID | 162168 | |
| Name | Narcissus cyclamineus | Legacy |
| Color | Yellow | 2009 survey |
| IUCN ID | 161899 |
If the “Source” column is selected as the notes column, this table is transformed to:
| Name | Color | IUCN ID | Source: Name | Source: Color |
|---|---|---|---|---|
| Galanthus nivalis | White | 162168 | IUCN | Contributed by Martha |
| Narcissus cyclamineus | Yellow | 161899 | Legacy | 2009 survey |
Notes columns can therefore be used to preserve provenance or other context about a particular key/value pair.
Row order
The order in which the key/value pairs appear matters. The Columnize operation will use the first key it encounters as the delimiter for entries: every time it encounters this key again, it will produce a new row, and add the following key/value pairs to that row.
Consider for instance the following table:
| Field | Data |
|---|---|
| Name | Galanthus nivalis |
| Color | White |
| IUCN ID | 162168 |
| Name | Crinum variabile |
| Name | Narcissus cyclamineus |
| Color | Yellow |
| IUCN ID | 161899 |
The occurrences of the “Name” value in the “Field” column define the boundaries of the entries. Because there is no other row between the “Crinum variabile” and the “Narcissus cyclamineus” rows, the “Color” and “IUCN ID” columns for the “Crinum variabile” entry will be empty:
| Name | Color | IUCN ID |
|---|---|---|
| Galanthus nivalis | White | 162168 |
| Crinum variabile | ||
| Narcissus cyclamineus | Yellow | 161899 |
This sensitivity to order is removed if there are extra columns: in that case, the first extra column will serve as the key for the new rows.
Extra columns
If your dataset contains extra columns, that are not being used as the key, value, or notes columns, they can be preserved by the operation. For this to work, they must have the same value in all old rows corresponding to a new row.
In the following example, the “Field” and “Data” columns are used as key and value columns respectively, and the “Wikidata ID” column is not selected:
| Field | Data | Wikidata ID |
|---|---|---|
| Name | Galanthus nivalis | Q109995 |
| Color | White | Q109995 |
| IUCN ID | 162168 | Q109995 |
| Name | Narcissus cyclamineus | Q1727024 |
| Color | Yellow | Q1727024 |
| IUCN ID | 161899 | Q1727024 |
This will be transformed to:
| Wikidata ID | Name | Color | IUCN ID |
|---|---|---|---|
| Q109995 | Galanthus nivalis | White | 162168 |
| Q1727024 | Narcissus cyclamineus | Yellow | 161899 |
This actually changes the operation: OpenRefine no longer looks for the first key (“Name”) but simply pivots all information based on the first extra column's values. Every old row with the same value gets transposed into one new row. If you have more than one extra column, they are pivoted as well but not used as the new key.
You can use to put identical values in the extra columns if you need to.